Description of problem
Trying to follow the tutorial for plotting values (such as voltage) along an extended neuron morphology. However, all compartments are inaccurately being plotted as the same color. Also, when using show_diameter=True, a strange red line appears in the middle of the cylindrical process.
Minimal code to reproduce problem
from brian2 import *
from brian2tools import *

morpho = Soma(diameter=30*um)
morpho.axon = Cylinder(length=300*um, diameter=4*um, n=30)
morpho.dendrite = Cylinder(length=300*um, diameter=10*um, n=30)
morpho = morpho.generate_coordinates(section_randomness=25,
                                         compartment_randomness=15)

plot_morphology(morpho,plot_3d = False)


gL = 1e-4*siemens/cm**2
EL = -70*mV
eqs = '''
Im=gL * (EL - v) : amp/meter**2
I : amp (point current)
'''
neuron = SpatialNeuron(morphology=morpho, model=eqs, Cm=1*uF/cm**2, Ri=100*ohm*cm)
neuron.v = EL + 10*mV

run(10*ms)

neuron.axon[140*um:145*um].I = 3*nA
run(4*ms)
neuron.axon[140*um:145*um].I = 0*nA
run(.1*ms)


plot_morphology(neuron.morphology,
                        # value_norm=(-46*mV, -35*mV),
                        show_compartments=False, show_diameter=True,
                        plot_3d=False, values=neuron.v)

pause(0.1)

plot(neuron.v/mV)
show()
What you have already tried
reinstalling brian2tools
looking at definition of plot_morphology to try and find error
plotting distance or other values
changing location of current input
Expected output (if relevant)
continuously changing value of neuron.v along the morphology
Actual output (if relevant)
Compare the plot_morphology (using values of neuron.v) figure to a raw plot of neuron.v
(it’s only letting me attach one image, but the call of plot(neuron.v/mV) at the bottom of the code is changing across compartments and ranges from -10 to 10 mV)
Hi @ianconehed. Um, this is indeed not working as it should, and the relevant code hasn’t been touched in 5 years at least  I’ve looked into the code and at least understand what is going wrong and why this slipped through the radar for a long time. When you plot in 2D, it uses only the value in the first compartment of each section to colour the whole section. In your example, there are three sections, a soma, an axon, and a dendrite. The membrane potential in the first (or for the soma: only) compartment is almost identical across sections, giving the impression that everything is filled with the same colour. In a morphology with many sections, e.g. one based on a reconstruction in an SWC file, this will not be that much of an issue, since each section has a few compartments and is fairly homogenous. For now, the only workaround is to use the 3D plotting, where it correctly plots the colour for each compartment.
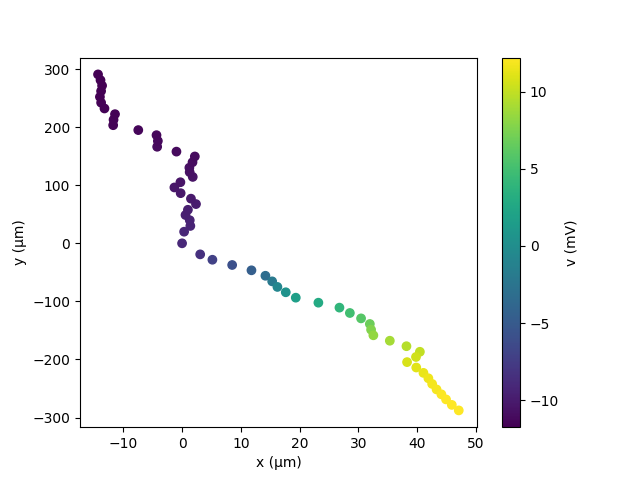
Yes, that makes sense. In fact, looking back at this image from the tutorial (which is an SWC reconstruction), you can see that it is a general problem with 2D plotting. Seems like at branch points it colors the whole section according to the first value of the section.
which I’m assuming is due to this part of the definition of plot_morphology_2D:
    for child in morpho.children:
        _plot_morphology2D(child, axes=axes,
                           values=values,
                           value_norm=value_norm,
                           voltage_colormap=voltage_colormap,
                           show_compartments=show_compartments,
                           show_diameter=show_diameter,
                           colors=colors, color_counter=color_counter+1)
Is there a way to iterate over each compartment, rather than just each section (child)? I will try the 3D plotting, but if I remember correctly mayavi requires some old dependencies which cause some issues (I think there’s already a forum post on this, though).
Unfortunately, it is not quite enough to iterate over the compartments: the reason we use one plot for a section is that this allows us to easily have the correct lines connecting all the compartments, and therefore construct a useful image of the morphology. If you are happy with just a simple plot that shows the value for each compartment at its position, you can directly make a scatter plot, for example:
plt.scatter(neuron.x[:]/um, neuron.y[:]/um, c=neuron.v[:]/mV)